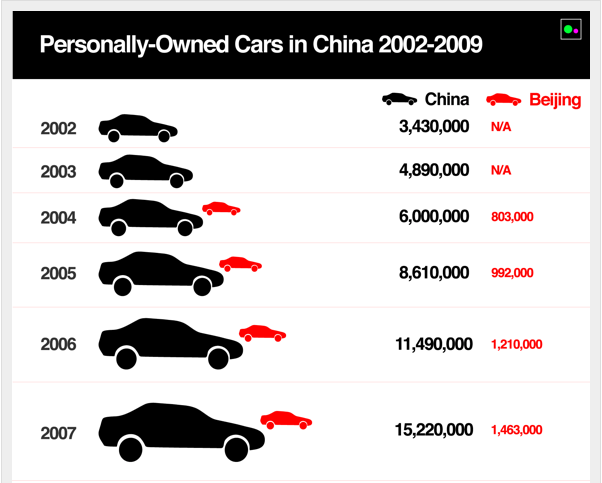
Check out Chinfographics, a great data visualization site that has a lot of useful graphics of data, statistics, and other phenomena regarding China. Each graphic is accompanied by a brief blog post explaining the data used to the develop the graphic, along with a bit of contextualization. I firmly believe in the power of eye-catching, simple yet effective means of communicating data.
Recent Posts
Recent Comments
- Danny on Yale Researchers Release Municipal Solar Scorecards for Connecticut
- Kyle on Yale Researchers Release Municipal Solar Scorecards for Connecticut
- AngelHsu on Analyzing Non-State and Sub-national Climate Pledges in NAZCA and the LPAA
- Susanne Konrad on Analyzing Non-State and Sub-national Climate Pledges in NAZCA and the LPAA
- Greg Robie on How Dirty is Your Air? This Map Shows You
Archives
- November 2016
- October 2016
- September 2016
- July 2016
- June 2016
- April 2016
- March 2016
- February 2016
- December 2015
- November 2015
- October 2015
- August 2015
- October 2014
- September 2014
- August 2014
- June 2014
- May 2014
- March 2014
- February 2014
- September 2013
- August 2013
- July 2013
- June 2013
- May 2013
- April 2013
- March 2013
- January 2013
- December 2012
- November 2012
- October 2012
- August 2012
- July 2012
- June 2012
- May 2012
- April 2012
- March 2012
- February 2012
- January 2012
- December 2011
- November 2011
- October 2011
- August 2011
- July 2011
- June 2011
- May 2011
- April 2011
- March 2011
- February 2011
- January 2011
- December 2010
- November 2010
- October 2010
- September 2010
- July 2010
- May 2010
- April 2010
- March 2010
- January 2010
- December 2009
Categories
- Air quality
- Apps
- Big data
- China
- Climate
- Data
- Data Visualization
- Energy
- Environmental Performance Index (EPI)
- Featured
- Field work
- Greenbank
- Groundswell
- India
- Indices
- Podcast
- Policy
- Presentations
- Publications
- Remote Sensing
- Sights
- Sustainability
- Sustainable transport
- Teaching
- The City Fix
- Uncategorized
- UNFCCC
- Urbanization

Nice to be visiting your blog again, it has been months for me. Well this article that i’ve been waited for so long.